· Under the Hood · 8 min read
Why the Same Request Is Fast, Then Slow, and How to Fix It
Same request. Same response. Same size. 0.3 seconds, then 0.9 seconds. Nothing is broken.
The server log said 4.8 ms both times.
Many teams read response time from the server: how long the handler took. That’s the slice that’s easy to see. In my test it was the smallest one. The rest is setup and waiting, and that’s the part that changes from one request to the next.
Words used here
- Response time: everything the user waits for, from sending the request to the last byte of the answer.
- Service time: the time your code actually works on the request. This is what the server log shows.
- Latency: the time the request waits instead of being worked on: opening the connection, travelling, waiting in line.
- Round trip: a message to the server and back. Frankfurt to London: 12 ms. Frankfurt to Sydney: 293 ms.
- TCP and TLS handshakes: opening a connection, then making it secure. One round trip each.
- Keep-alive: reusing an open connection, so the handshakes are paid once.
- p50, p95, p99: half, 95% and 99% of requests are faster than this. p99 is “the tail”: the slowest 1%.
- Load: how busy the server is, as a share of the most it can handle.
- Knee: the load where waiting in line starts to grow much faster than the load itself.
People often use “latency” for all of it. In this piece the three are kept apart, because they’re measured in different places.
The test
One HTTPS endpoint on an AWS EC2 t3.micro in Frankfurt. It returns the same 3-item order every time (462 bytes) after the same fixed work: 4.8 ms of service time. The clients are two more t3.micros: one in London, close by, and one in Sydney, on the other side of the world. So the network is real, not simulated.
I measured three things from the client: one request split into stages (from both cities), the same request under growing load, and a page that calls many services at once (from London). Two runs each. The client’s own delay stayed under 2.2 ms, so it wasn’t the bottleneck.
Where the 0.9 seconds go
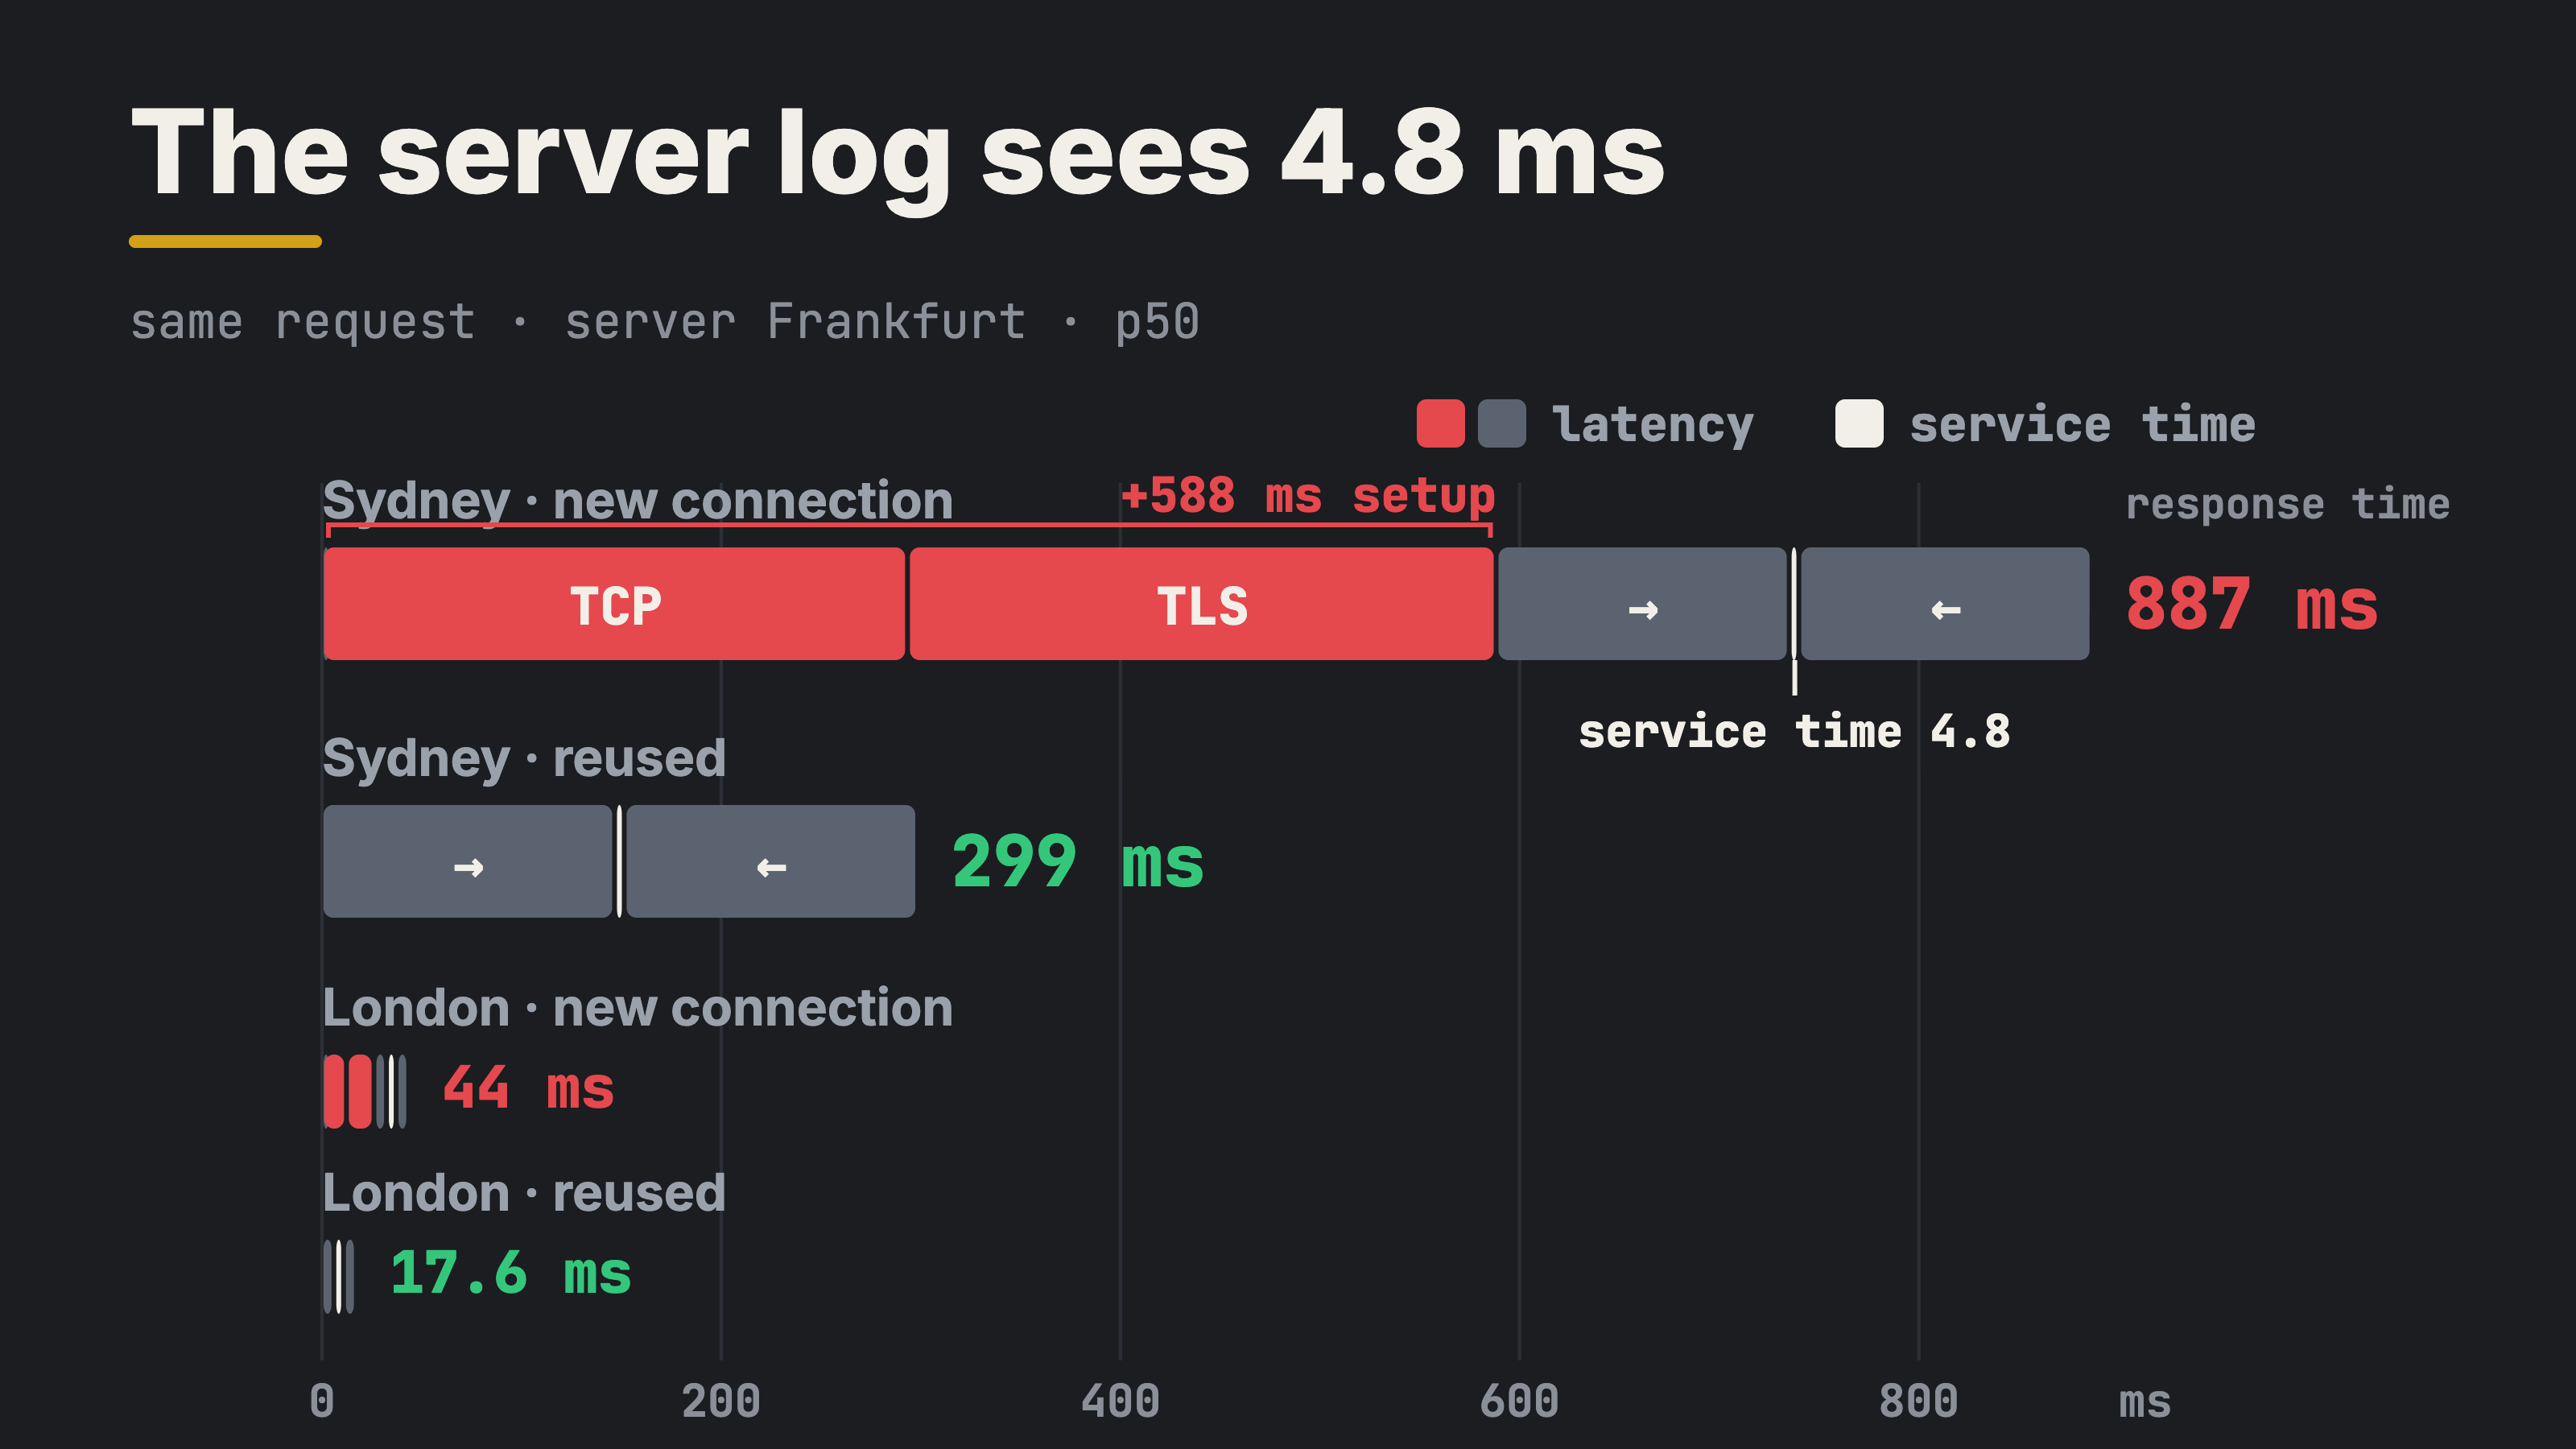
On a new connection, before your code sees a single byte:
- DNS: under 1 ms here, because the cloud resolver had the answer cached. A phone resolving from scratch pays more.
- TCP connect: one round trip. 293 ms from Sydney, 12 ms from London.
- TLS 1.3 handshake: one more round trip plus the crypto. 295 ms from Sydney, 14 ms from London. (TLS 1.2 needs two round trips.)
Then the request itself: the request travels to the server, waits in line, gets 4.8 ms of work, and the response travels back. 298 ms from Sydney, 17 ms from London.
So from Sydney, the response time was 0.89 seconds on a new connection and 0.29 to 0.30 seconds on a reused one. From London, 44 ms and 17.6 ms. The same 4.8 ms of service time every time. From Sydney, that’s under 1% of what the user waited for. The rest was latency.
Distance doesn’t change your code. It multiplies everything around it: a new connection costs about three round trips, a reused one costs one. From Sydney, the setup alone was 588 ms, on every new connection, and the server log never shows it.
Same work, different wait
Next, the same request under load, from London. First I measured the server’s max: about 205 requests a second. Then I sent requests at 20% to 90% of that, at random intervals like real users, not one after another. Each request was timed from when it was due, not when it was sent, so a slow server can’t hide the requests it delayed.
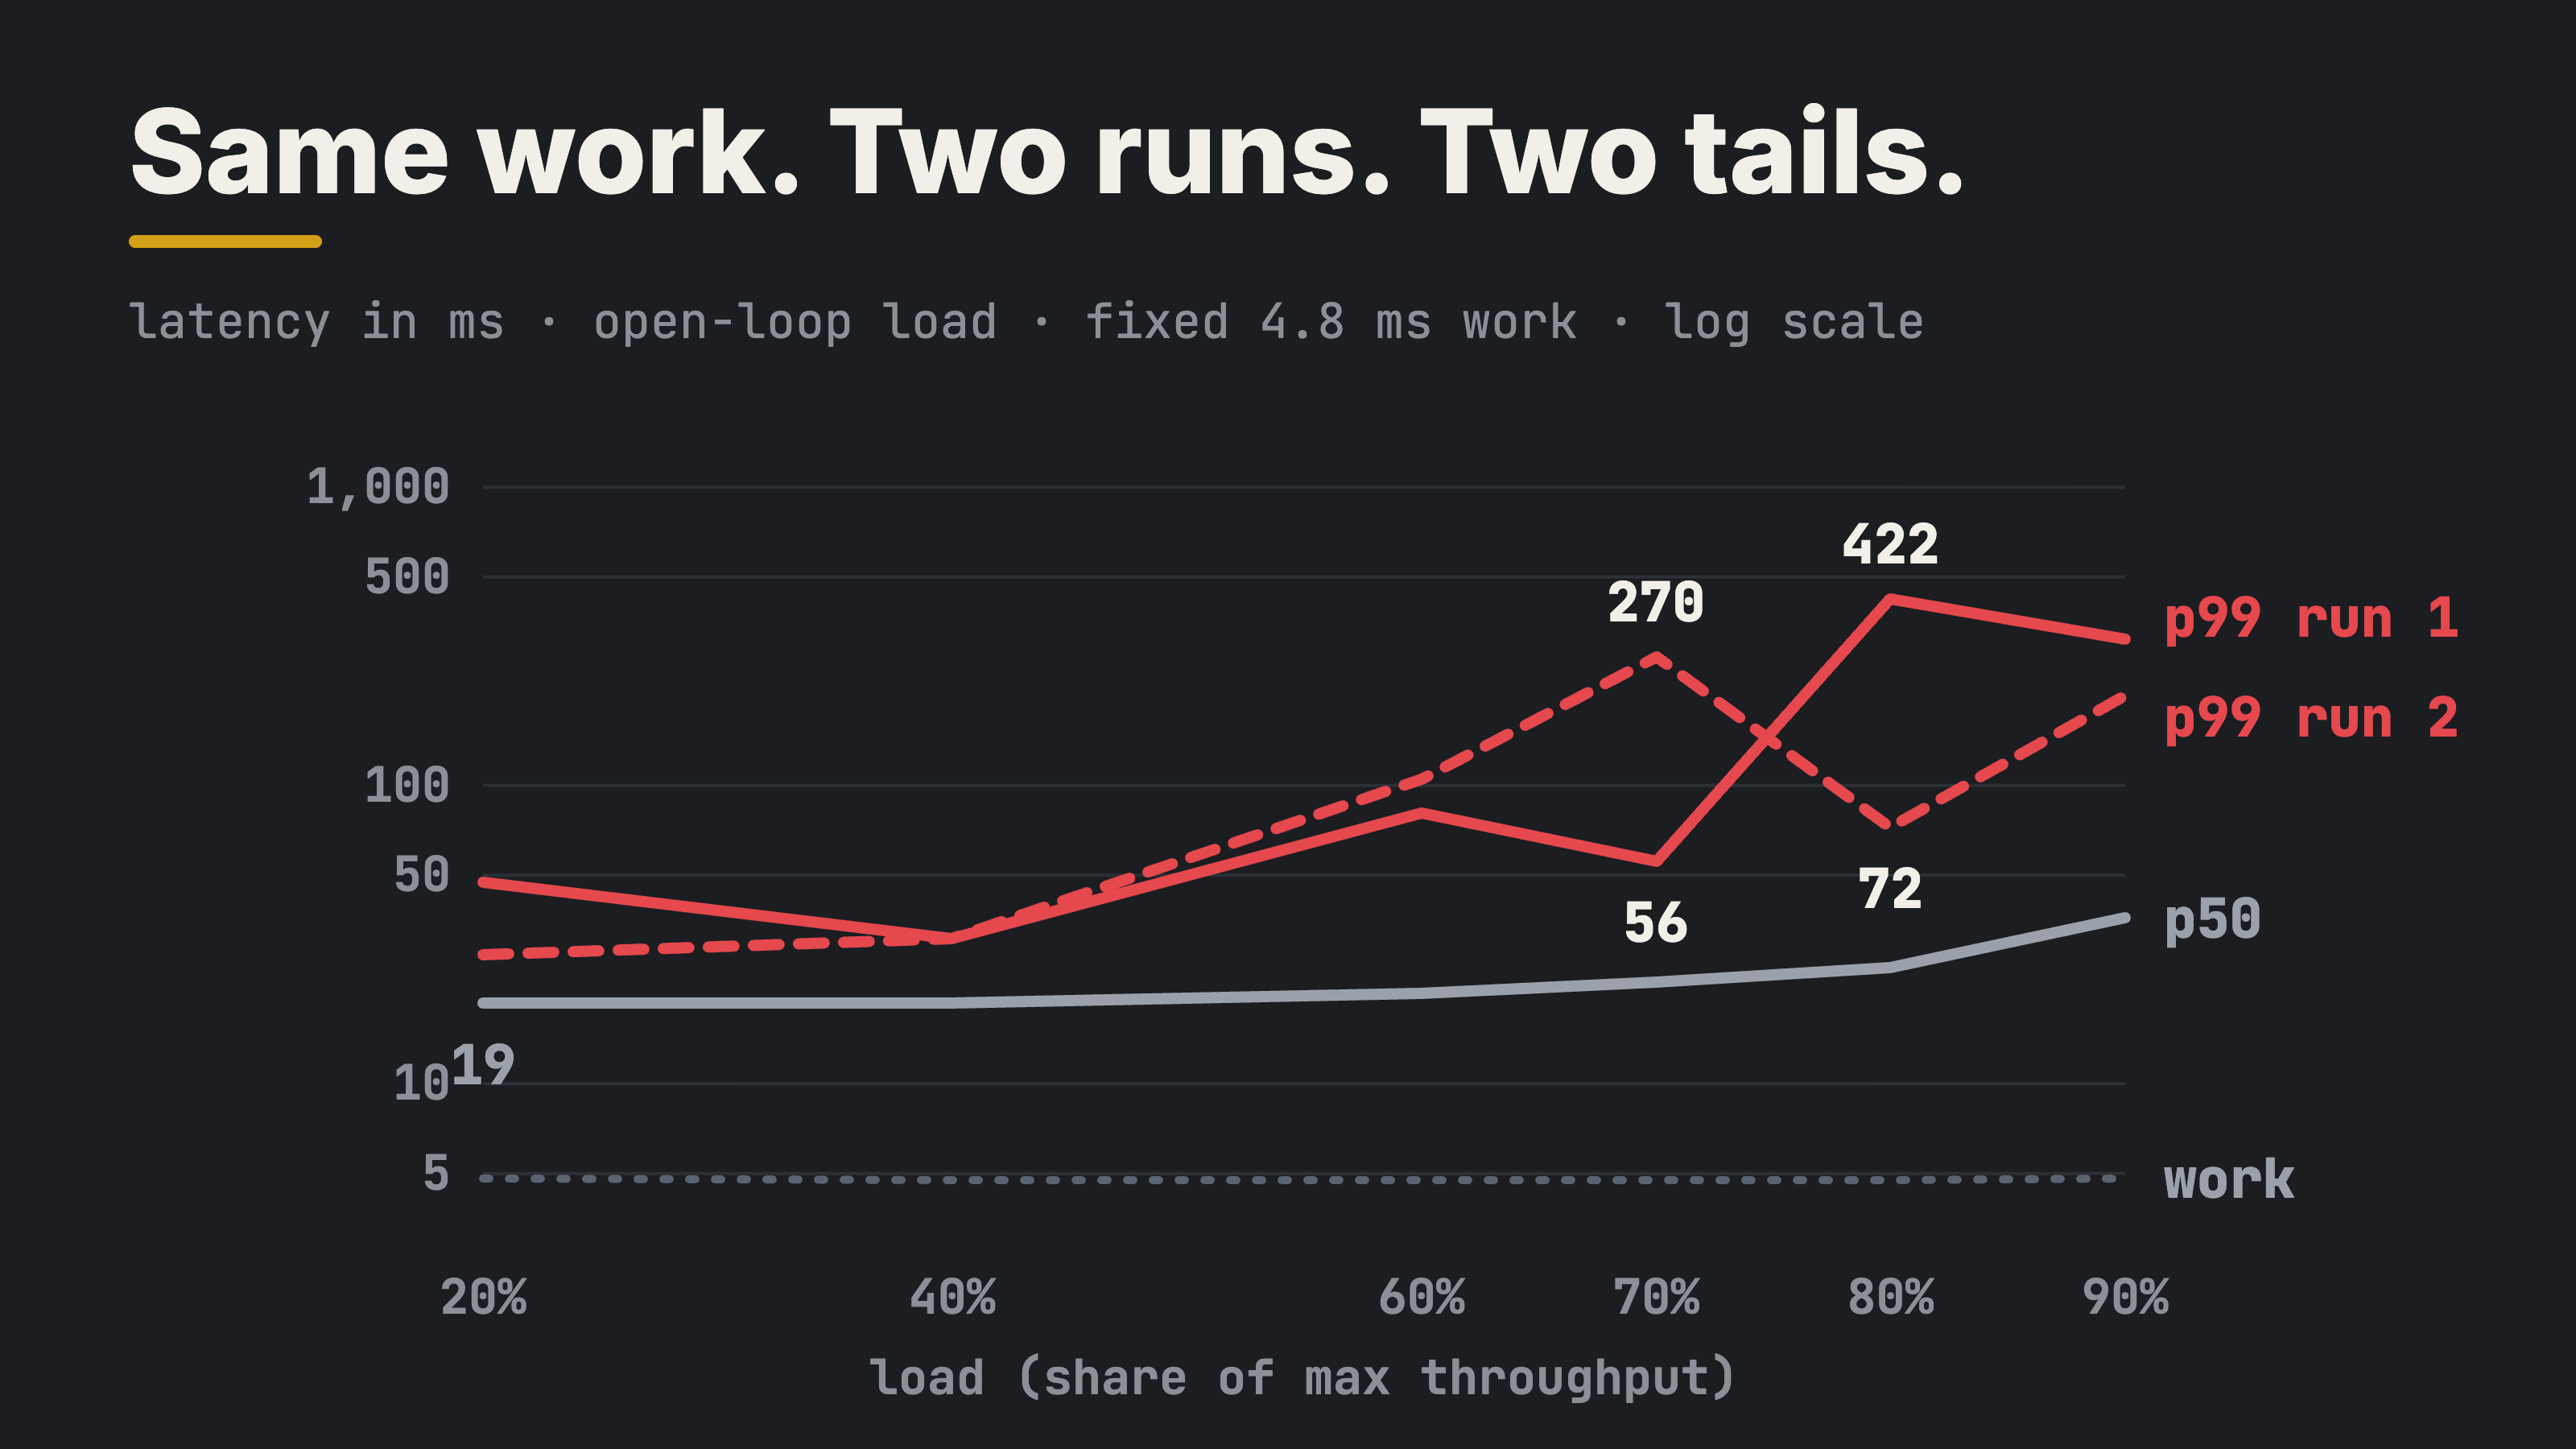
Service time never moved: 4.8 ms at every step. What changed was the wait in line, so latency grew.
- p50 (the typical request) stayed at 18 to 22 ms up to 70% load, then climbed: 24 to 25 ms at 80%, 33 to 39 ms at 90%.
- p95 went from 26 ms at 40% load to 131 to 263 ms at 90%.
- p99 didn’t repeat. At 70% load it was 56 ms in one run and 270 ms in the other. At 80%, 422 ms and 72 ms. Same server, same requests, same work.
Why p99 jumps: a few times per run, something stalled for 0.3 to 1 second, and every request that arrived during it waited in line behind it. At 165 requests a second, a 1-second stall delays about 165 requests. That’s more than 1% of a minute, so it becomes the p99. Over the session, the server resent 34 lost TCP packets (a lost packet waits at least 200 ms before it’s sent again) and lost 6 seconds of CPU to other virtual machines on the same host. I didn’t tie each spike to its cause. But neither of them is in your code, and neither shows in the server log.
That’s the point of two runs: the typical request repeats, the tail doesn’t. If you measure p99 once, you measured that minute, not your system.
One slow call becomes many slow pages
A page or an API that calls several services in parallel waits for the slowest one. I took the measured latencies and built pages of 1, 5, 10 and 50 calls from them. This assumes the calls are independent and behave like this server; real services differ, but the effect is the same.
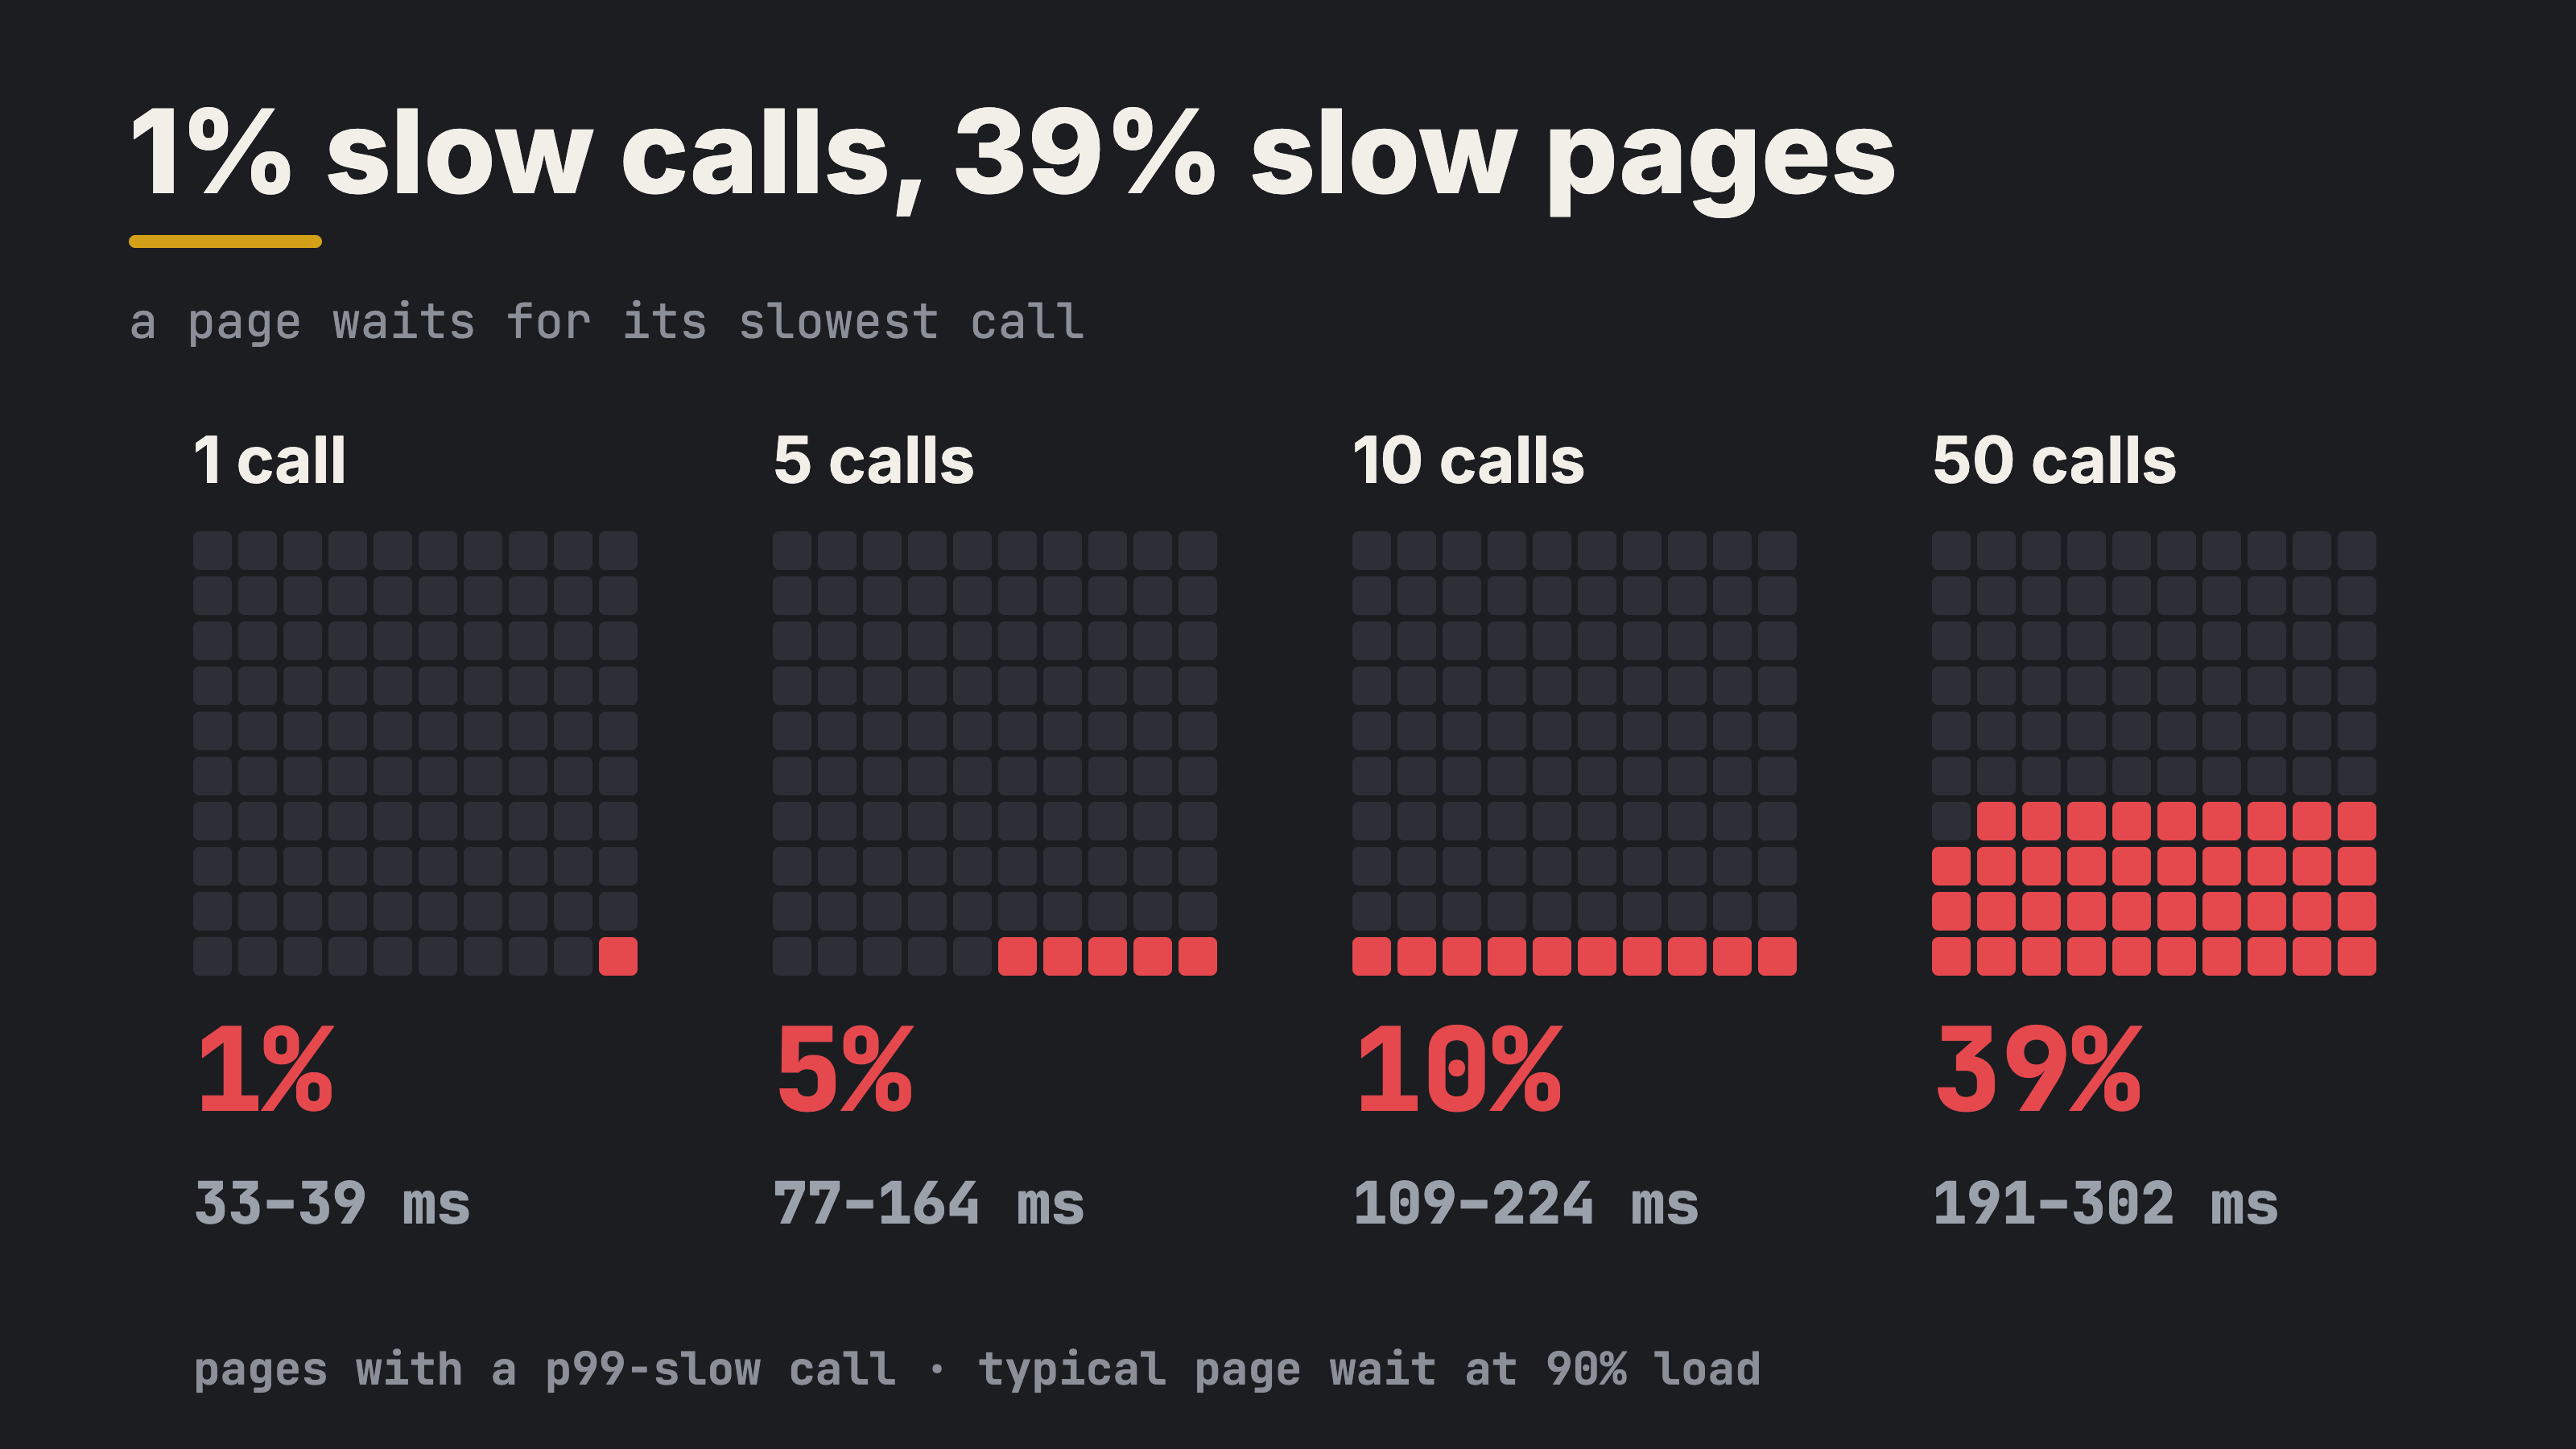
By definition, 1% of calls are slower than p99. A page of 10 calls hits at least one of them 10% of the time. A page of 50 calls, 39% of the time. The math is simple: 1 - 0.99^n. The tested numbers match it.
At 40% load it barely matters: a page of 10 calls typically waits 25 ms against 19 ms for one call. At 90% load it’s 109 to 224 ms against 33 to 39 ms. The tail of one call becomes the typical page.
The cheap fixes first
Reuse connections. Keep-alive and connection pools take DNS, TCP and TLS out of every call after the first. In the test: 0.89 s to 0.3 s from Sydney, 44 ms to 17.6 ms from London. Usually this is one setting: check your HTTP client, your database driver and the calls between your services. A new client per request is the common mistake.
Keep headroom. On this server, p50 was flat until 70% load, and p95 grew fast after it: 41 to 46 ms at 70%, 131 to 263 ms at 90%. Above that point, waiting in line grows faster than the load. Your knee will be somewhere else; find it with a load test, then keep normal traffic below it. More workers move the knee to the right; they don’t remove it.
Cut hops. Every call in series adds its full response time. Every call in parallel adds a chance of hitting the slow one. Fewer calls per page often beats faster calls.
Then the tail. If p99 still hurts: timeouts with one retry, or hedged requests (send a second copy if the first is slow, use whichever answers first). Both add load, so they come last. I didn’t test them here.
What the test doesn’t cover
- One small server. One Python worker, one request at a time, about 205 requests a second. The milliseconds are this server’s; compare the ratios. A real service has more workers and handles 100 or 10,000 requests a second, so its knee comes at a different load. The curve is about how busy the server is, not how many requests it gets, so the shape stays.
- Cloud to cloud. Both clients sat in data centres. A phone on mobile data adds its own 50 to 100 ms per round trip on top, so the setup cost grows to match.
- HTTP/1.1. HTTP/2 shares one connection for many requests. HTTP/3 (QUIC) opens the connection and sets up TLS in one round trip, and resumed sessions can send data in the first one. All of them attack the same setup round trips.
- CDN, edge or a closer region. Ending TLS close to the user often cuts the setup round trips to a few milliseconds, and a server in the user’s region cuts every round trip. For users far from your only region, that’s the biggest fix of all. Your origin still has its own queue.
Decision
Fix the slice the user waits on, cheapest first.
- Measure at the client. p50, p95 and p99, split by stage, under realistic load (requests arriving on their own schedule, like real users, not one after another). Run it more than once and read p99 as a range.
- Reuse connections. Keep-alive and pools everywhere: browser to API, service to service, service to database.
- Keep headroom. Load-test to find your knee, and keep normal traffic below it.
- Cut hops. Fewer calls in series and in parallel. Hedge only if the tail still hurts.
- Move closer. If your users are far from your only region, a CDN or edge ends TLS near them, and a second region cuts every round trip. The biggest fix, and the most expensive one, so it comes last.
Trade-off
You fix what the user feels, not what the server log shows. It costs work: client-side measurement and tracing. Connection pools need sizing and handling of dead connections. Headroom means paying for capacity you don’t use most of the day. Hedged requests add load.
Principle
Measure response time where the user waits, not where the server works.
What’s the gap between your server log and what your users see? Tell me in the comments.
Code and full results: https://github.com/archemist-dev/labs/tree/main/04-response-time
Credit: Martin Kleppmann and Chris Riccomini, Designing Data-Intensive Applications, 2nd ed., on response time, latency and tail latency; Jeffrey Dean and Luiz André Barroso, “The Tail at Scale” (2013); Gil Tene, “How NOT to Measure Latency”; RFC 8446 (TLS 1.3). The words, test and numbers are mine.